Data Analysis & Visualization
SQL, Python, Tableau, and Excel — cleaning messy data, surfacing KPIs, and building visuals that help non-technical stakeholders act.
Open to internships & full-time roles
Data Analytics and Machine Learning professional finishing an M.S. at Yeshiva University. I turn messy, real-world data into answers that change decisions.
6.3M
Transactions analyzed
65%
Fraud recall
36.9%
Queens tree canopy share
Dec 2026
M.S. graduation
What I do
SQL, Python, Tableau, and Excel — cleaning messy data, surfacing KPIs, and building visuals that help non-technical stakeholders act.
Count models, feature engineering, and cross-validated statistical workflows on large real-world datasets like NYSED district records.
Neo4j, Cypher, and GDS for fraud detection and network analysis at scale across millions of nodes and relationships.
Portfolio
Modeled 6.3M mobile money transactions across 9M+ accounts as a 15.4M-node Neo4j graph to detect fraud patterns invisible at the individual-transaction level.
View case study →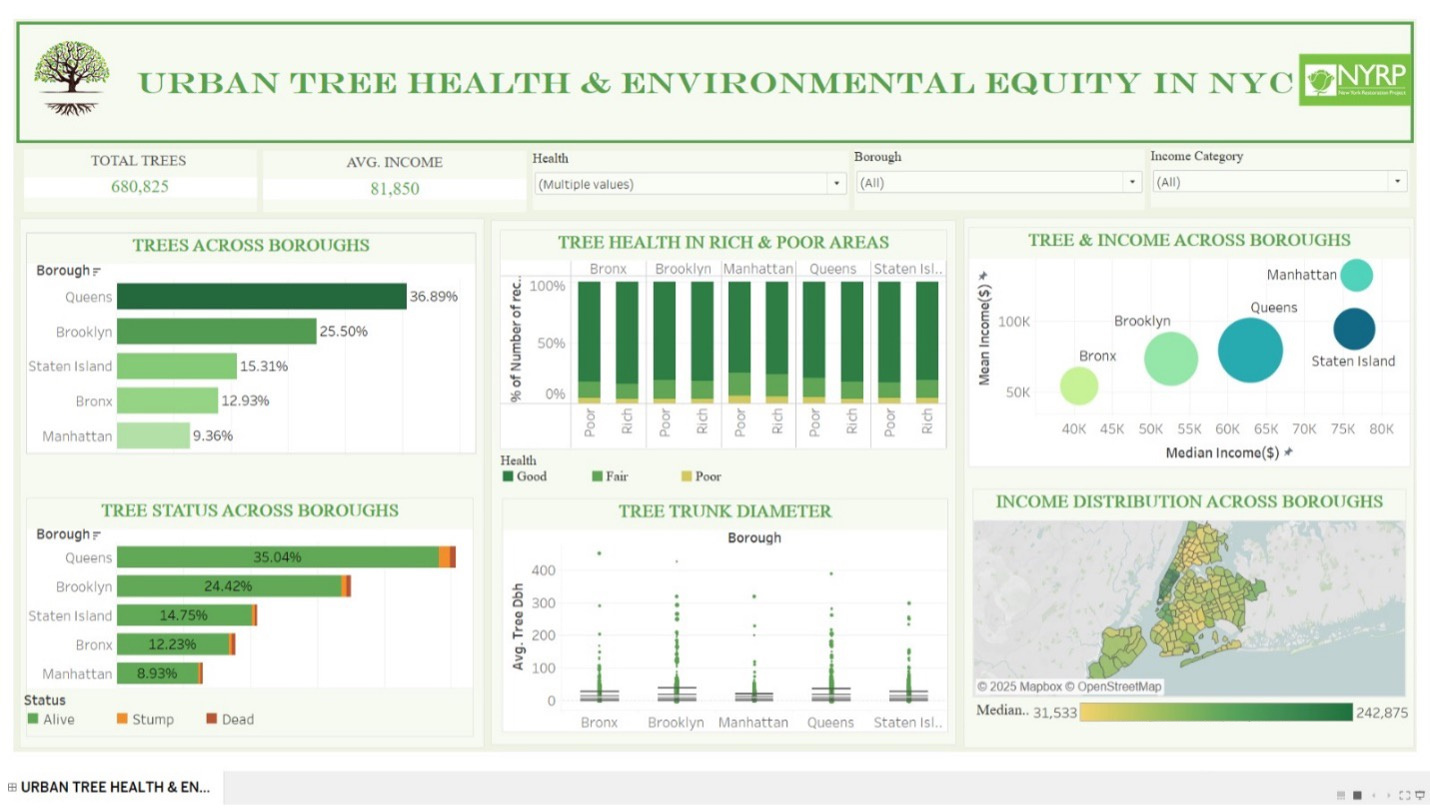
Analyzed the 2015 NYC Street Tree Census with 2024 neighborhood income data in Tableau for the New York Restoration Project to surface environmental equity gaps in urban tree coverage.
View case study →
Analyzed 39,674 NYSED school district records (140 variables) to identify the factors most associated with student dropout across New York State.
View case study →
Built a hybrid Neo4j movie recommender modeling users, movies, genres, and directors, combining Jaccard collaborative filtering with FastRP embeddings and Precision@K evaluation.
View case study →
Predicted 10-year CHD risk on the Framingham teaching dataset with KNN imputation, SMOTE balancing, clinical interaction features, and a seven-model bake-off including ensembles.
View case study →About me
Hi, I'm Arnold, a data professional with a computer science background, finishing an M.S. in Data Analytics and Visualization at Yeshiva University. I work end to end, from cleaning and exploring raw data to building models and putting the results in front of people who have to make decisions.
My work starts with a messy, real-world question and ends with a number that settles it: a $12B fraud blind spot a rule-based system never caught, the strongest predictors of why students drop out, a map of where NYC's trees really are. Different fields, same job. I'm at my best when the data has to earn a decision, not just fill a report.
Education
A CS undergraduate grounding in Beijing, now building specialized depth in data analytics and visualization in New York.
In progress
Completed
Stack & tools
Languages, libraries, databases, and methods I reach for across analysis, modeling, and graph data science.
Languages for analysis and graph work
End-to-end analytical workflow
Dashboards, charts, and stakeholder-ready views
Relational and graph data stores
Version control and data infrastructure
Background
99.81%
Fraud missed by rule-based system
Only 16 of 8,213 fraud transactions caught — $12B+ concealed
65%
Unsupervised fraud recall
2,660 fraud account pairs via Louvain on a 15.4M-node graph
36.9%
Queens share of NYC street trees
vs 9.36% in Manhattan — canopy does not track income
Avana Motors · Harare, Zimbabwe
Certification
Neo4j GraphAcademy · Apr 2026
Insights
Rules caught only 16 of 8,213 fraud transactions. On a 15.4M-node graph, Louvain recovered 2,660 fraud pairs unsupervised — about 65% recall on a $12B blind spot.
Read more →Queens holds 36.89% of street trees versus Manhattan’s 9.36%. For NYRP, Tableau showed canopy gaps do not track neighborhood income — so planting should follow equity, not wealth.
Read more →
On 39,674 NYSED records (140 variables), migrant and ELL students face 3× higher dropout rates, NYC averages 13.2% vs 7.5% elsewhere, and enrollment size is the strongest driver.
Read more →
With only 20% rating density and almost no low scores, collaborative filtering alone collapses. Enriching the graph with Genre and Director nodes is what makes hybrid scoring work.
Read more →Get in touch
Seeking data analyst and data science internships in the NYC area for Fall 2026, and full-time roles beginning December 2026 anywhere in the U.S., open to relocation.