Wealthier is not greener: what NYC street trees reveal about equity
Queens holds 36.89% of street trees versus Manhattan’s 9.36%. For NYRP, Tableau showed canopy gaps do not track neighborhood income — so planting should follow equity, not wealth.
Arnold Muzarurwi
Data Analyst candidate
The equity question NYRP needed answered
As Business Intelligence Analyst on Alta Analytics, I helped brief the New York Restoration Project on a deceptively simple claim: do wealthier NYC neighborhoods also get healthier, denser street trees?
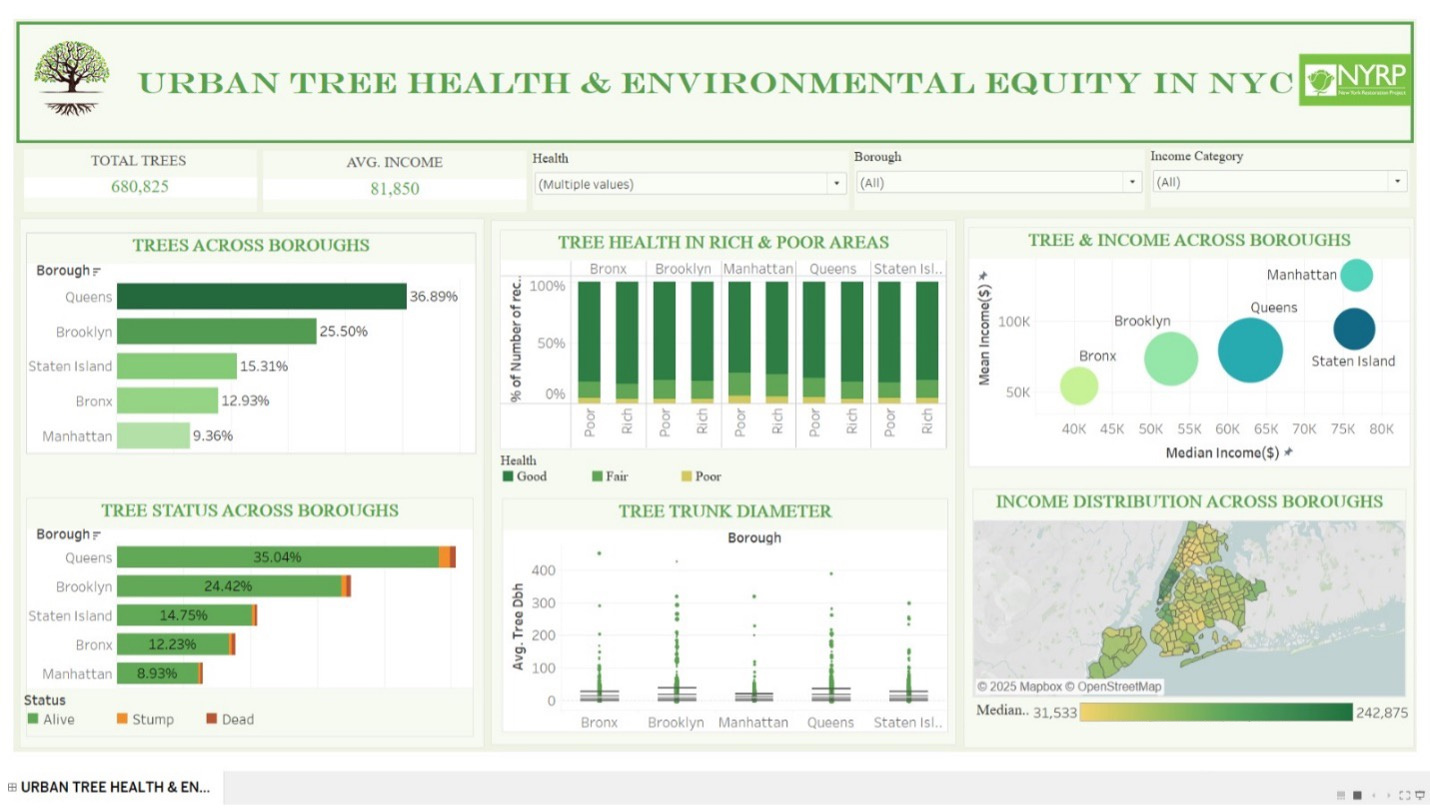
We joined the 2015 NYC Street Tree Census (680,825 trees) with 2024 income data and built a Tableau dashboard that answers three sponsor questions — distribution by borough, health gaps by income, and whether income predicts canopy.
Queens has the trees; Manhattan has the money
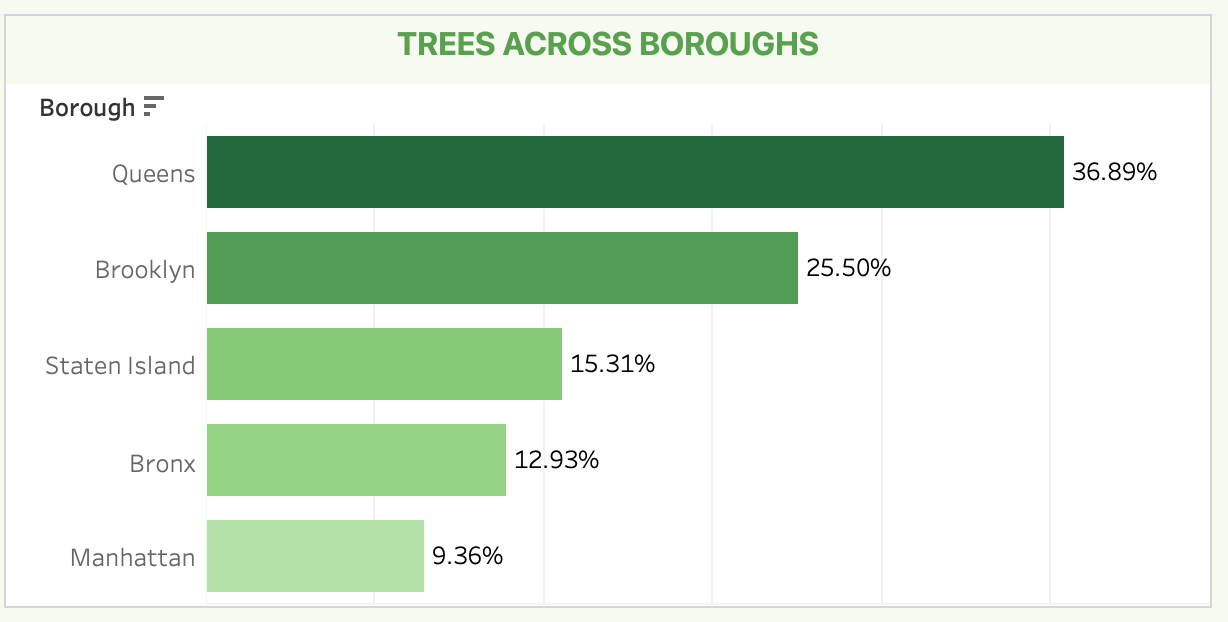
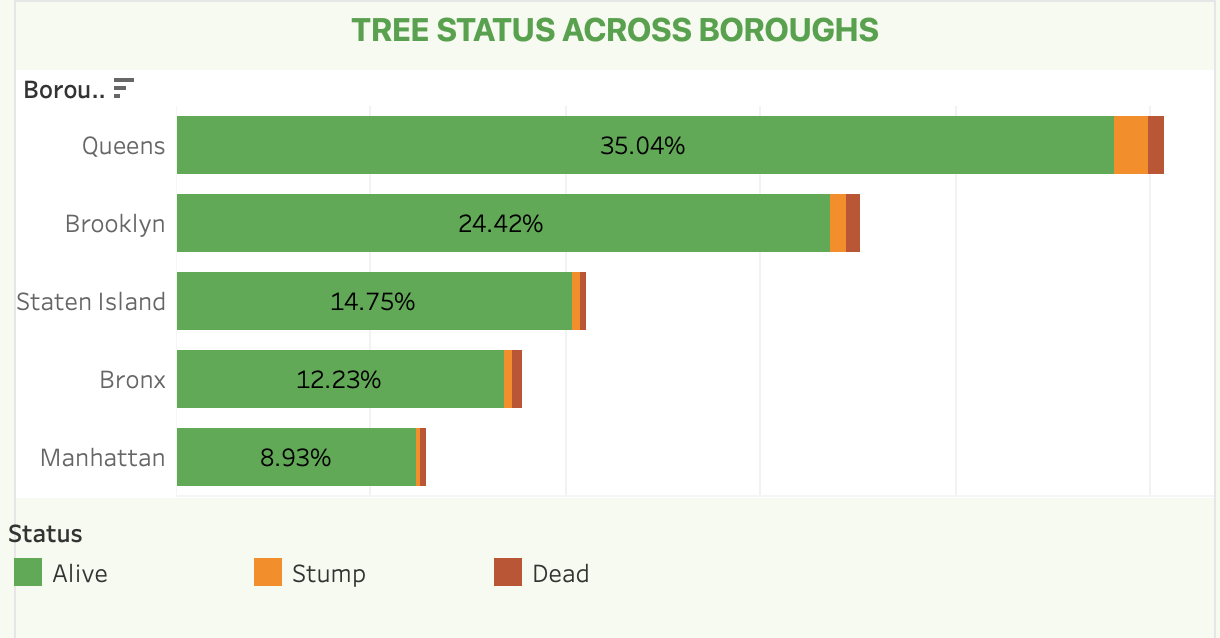
Borough share is the first chart stakeholders remember: Queens 36.89%, Brooklyn 25.50%, Staten Island 15.31%, Bronx 12.93%, Manhattan 9.36%. That is not a small gap — it is the planting map.
Alive dominates; health barely tracks wealth
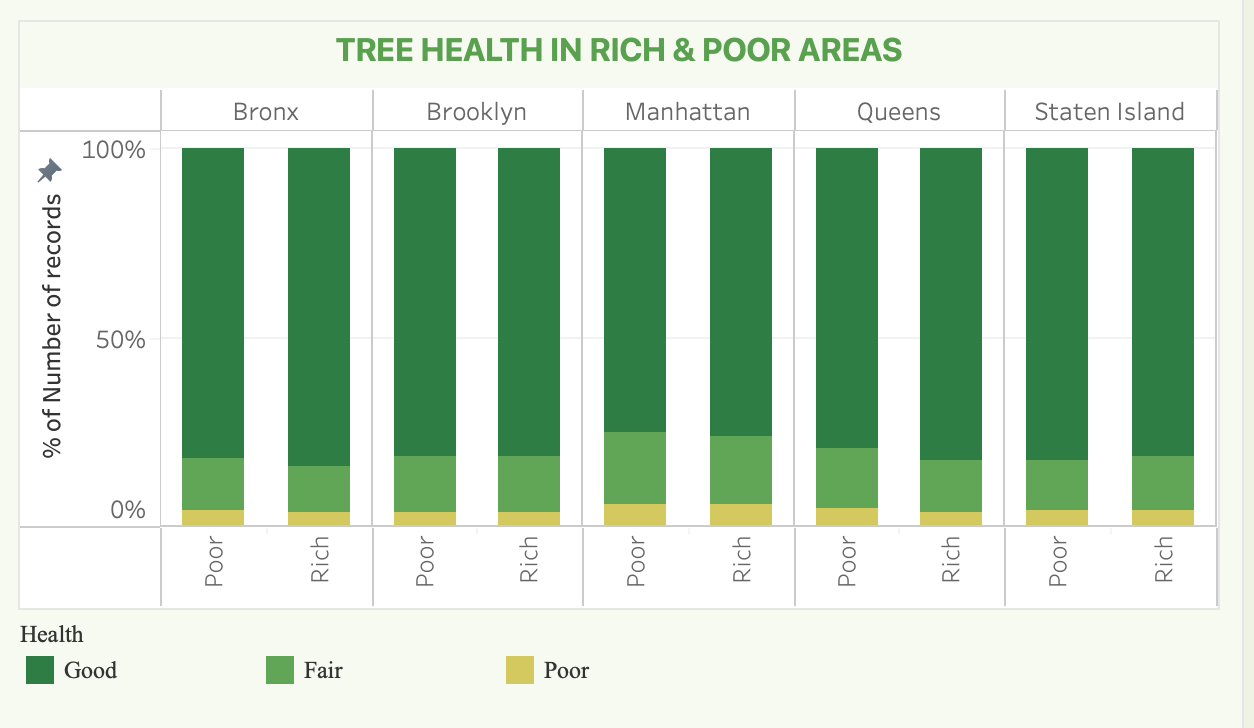
Status is overwhelmingly Alive everywhere. Health split by Rich vs Poor shows Good still at ~80–85% on both sides. Manhattan carries a bit more Fair/Poor; some lower-income Queens and Brooklyn pockets do too. That is a maintenance cue — not proof that poor neighborhoods have dead forests.
The map that breaks the slogan
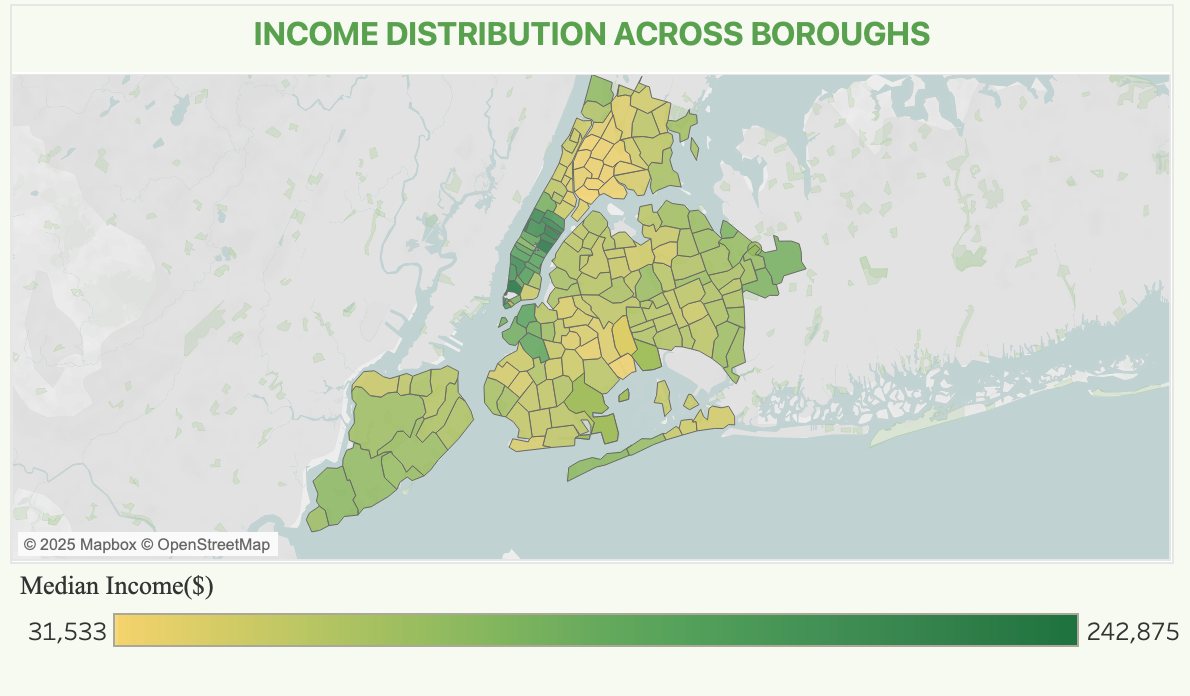
Neighborhood median income spans about $31.5k–$243k. Manhattan lights up dark green on the choropleth. Pair that with canopy volume and the slogan fails: high-income tracts are not the greenest, and mid-income Queens carries the largest share of street trees.
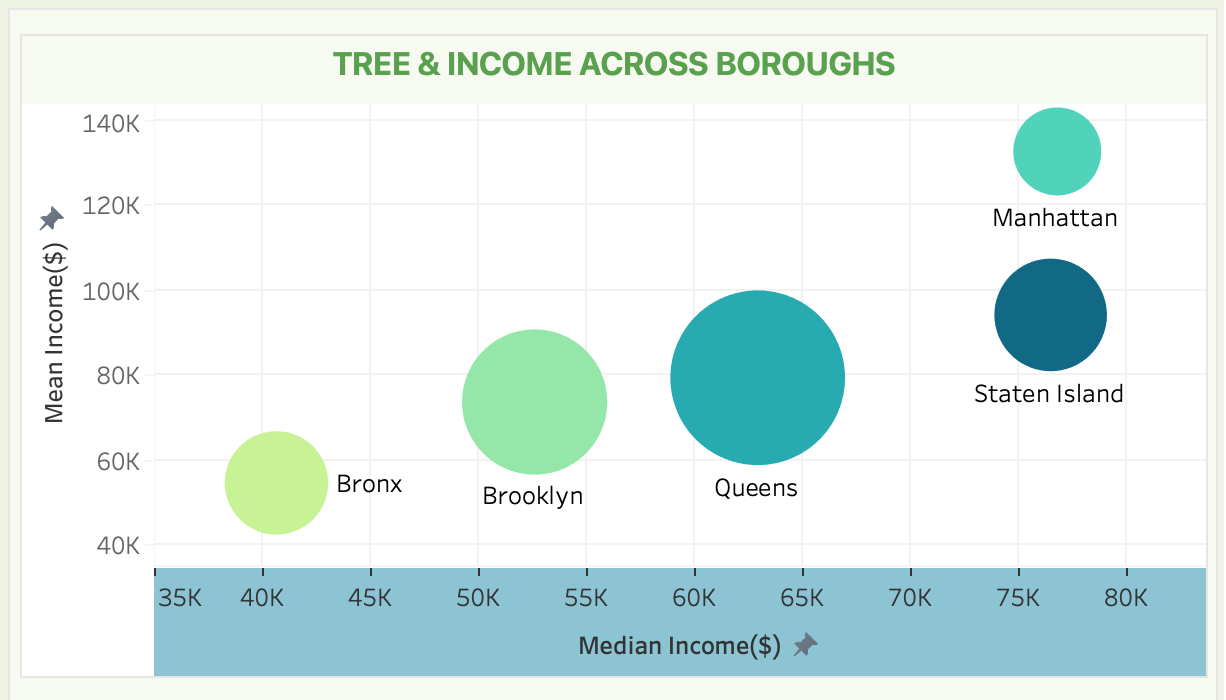
Income and tree count move independently. Density and land use explain canopy better than median income — so “plant where it’s poor” and “plant where it’s rich” are both incomplete slogans.
What we recommended
Plant creatively in canopy-scarce Manhattan. Keep Queens’ cover as a model. Focus maintenance where Fair/Poor health concentrates in lower-income Queens and Brooklyn. Support new projects in underserved Bronx and Brooklyn neighborhoods without assuming wealth already bought greenery.
That is the BI job: turn open data into a briefing a nonprofit can act on — not a chart that only restates the census.
Want to discuss this work? Get in touch.