NYC Street Tree Equity AnalysisAlta Analytics · New York Restoration Project
Analyzed the 2015 NYC Street Tree Census with 2024 neighborhood income data in Tableau for the New York Restoration Project to surface environmental equity gaps in urban tree coverage.
Role
Business Intelligence Analyst
Category
Business Intelligence
Year
2025
Client
New York Restoration Project (NYRP)
Deliverables
Tableau dashboard, stakeholder presentation, planting recommendations
680k
Street trees in the census
36.9%
Queens share of canopy
9.4%
Manhattan share of canopy
May 2025
Alta Analytics · NYRP
The problem
For the New York Restoration Project (NYRP), Alta Analytics analyzed the 2015 NYC Street Tree Census with 2024 neighborhood income data in Tableau to surface environmental equity gaps in urban tree coverage — and translate findings into planting recommendations a non-technical stakeholder audience could use.
I contributed as Business Intelligence Analyst on a five-person team spanning project management, client solutions, data engineering, BI, and visualization.
Data & objectives
- 2015 NYC Street Tree Census (updated through 2024) — 680,825 trees with borough, status (alive / dead / stump), health condition, and trunk diameter (DBH)
- 2024 NYC Income Dataset — neighborhood and borough median income for equity comparisons
NYRP’s briefing asked three operational questions: How does tree distribution vary by borough? Are health outcomes different in high- vs low-income areas? Does higher median income correlate with more trees?
The dashboard
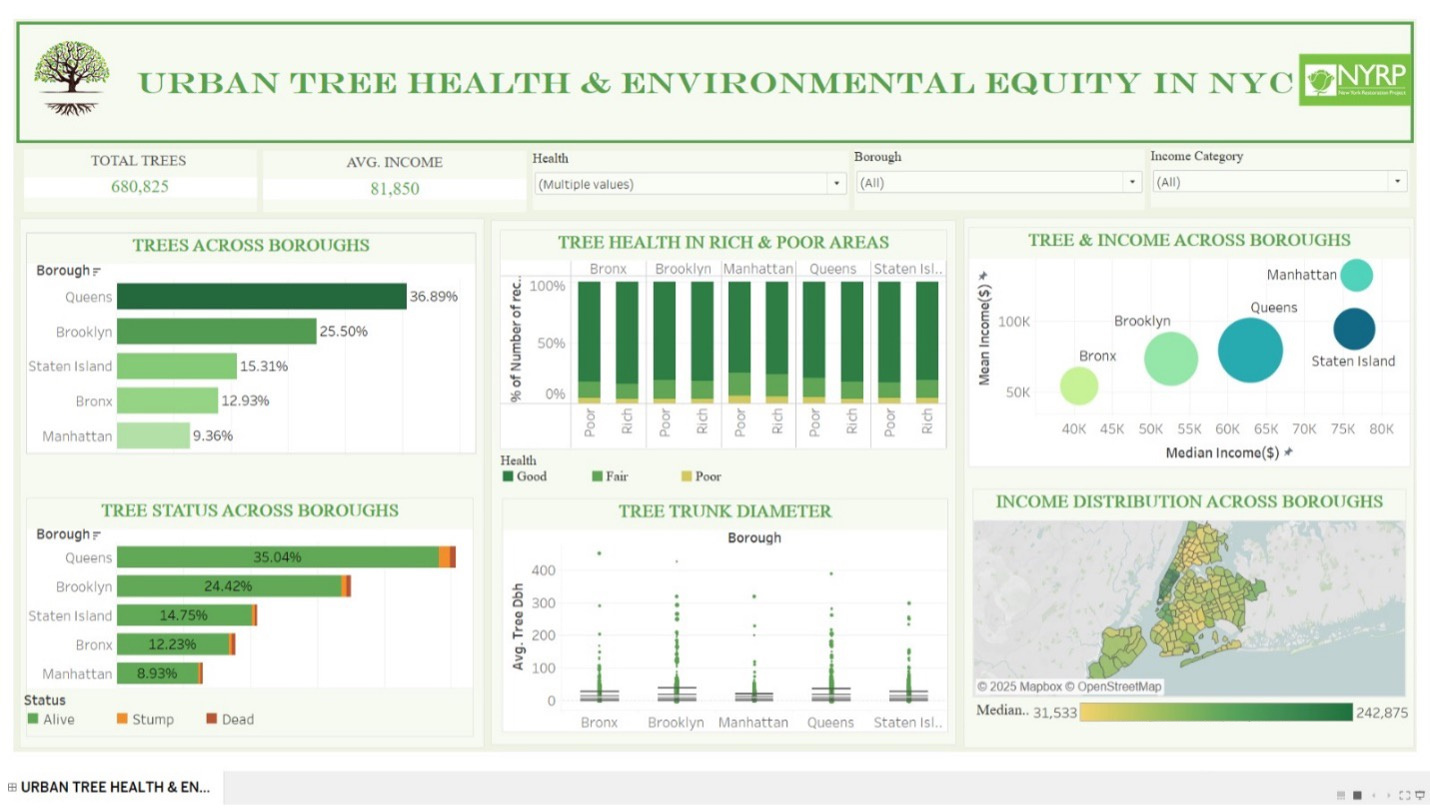
We delivered a single Tableau view that puts canopy, health, status, size, and income on one page — so stakeholders can filter by borough, health, and income category without flipping between slides.
Finding 1 — Canopy is uneven by borough
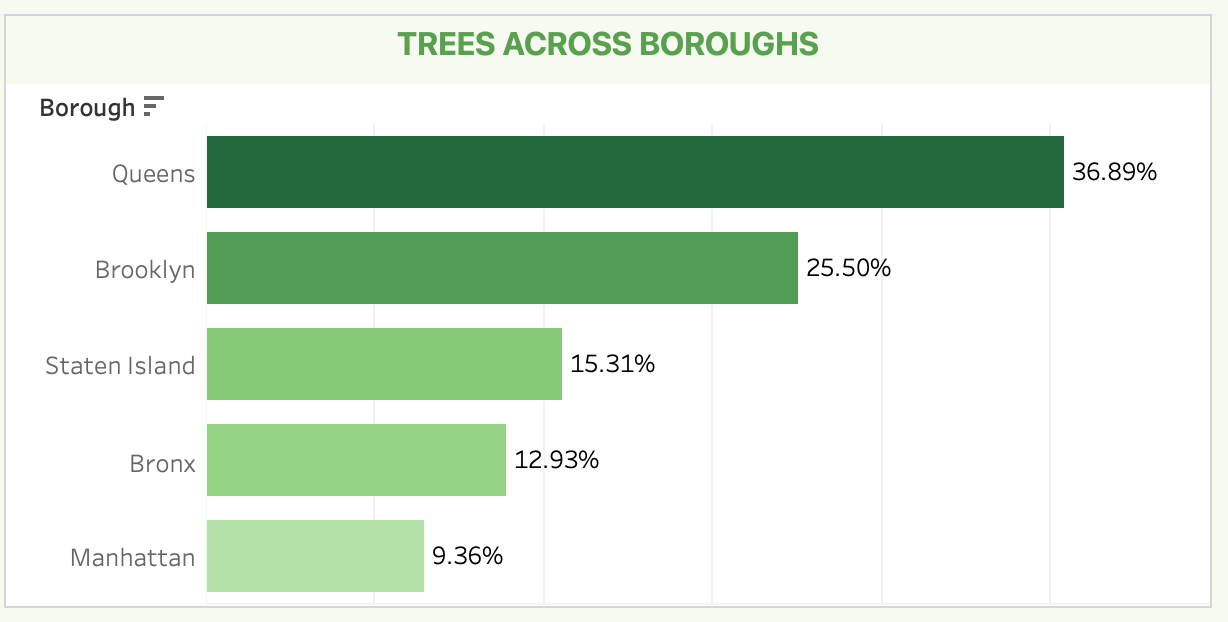
Queens holds 36.89% of street trees. Manhattan holds only 9.36%. Brooklyn (25.50%), Staten Island (15.31%), and the Bronx (12.93%) sit in between. That gap is the first map for planting priority — not a footnote.
Finding 2 — Most trees are alive; mortality is local
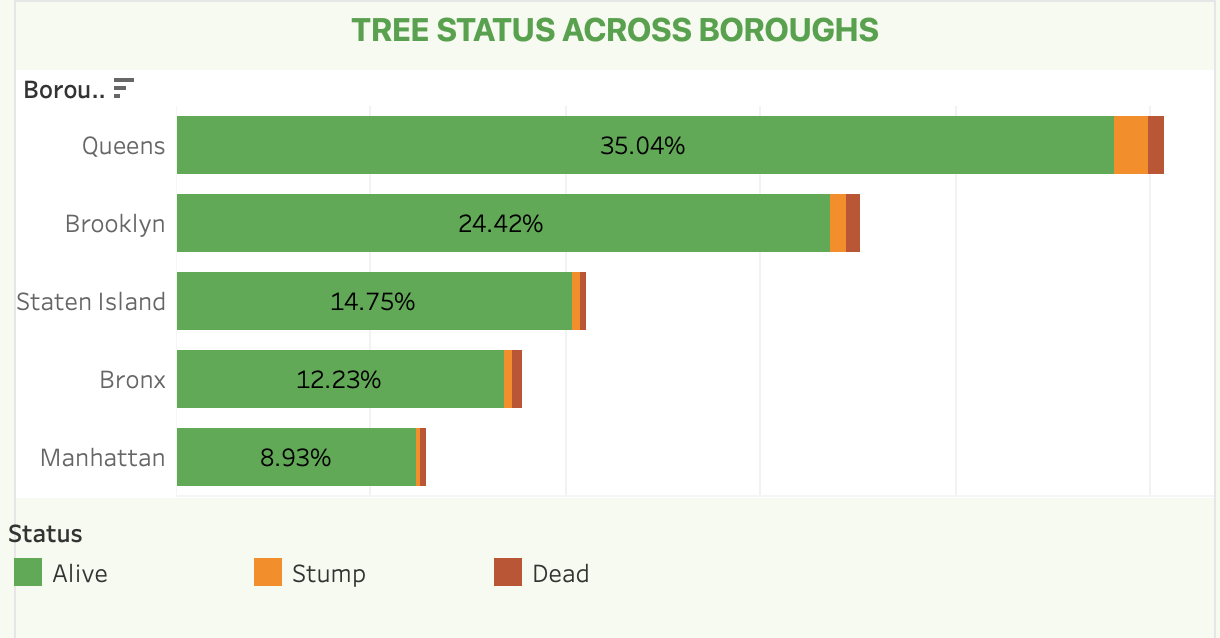
Status breaks overwhelmingly toward Alive. Queens still leads on absolute alive share (35.04%), then Brooklyn (24.42%), Staten Island (14.75%), Bronx (12.23%), and Manhattan (8.93%). Dead trees and stumps are thin slices everywhere — with slightly higher mortality signals in Staten Island and Queens, pointing to targeted removal and replacement rather than a citywide crisis.
Finding 3 — Income does not rewrite health
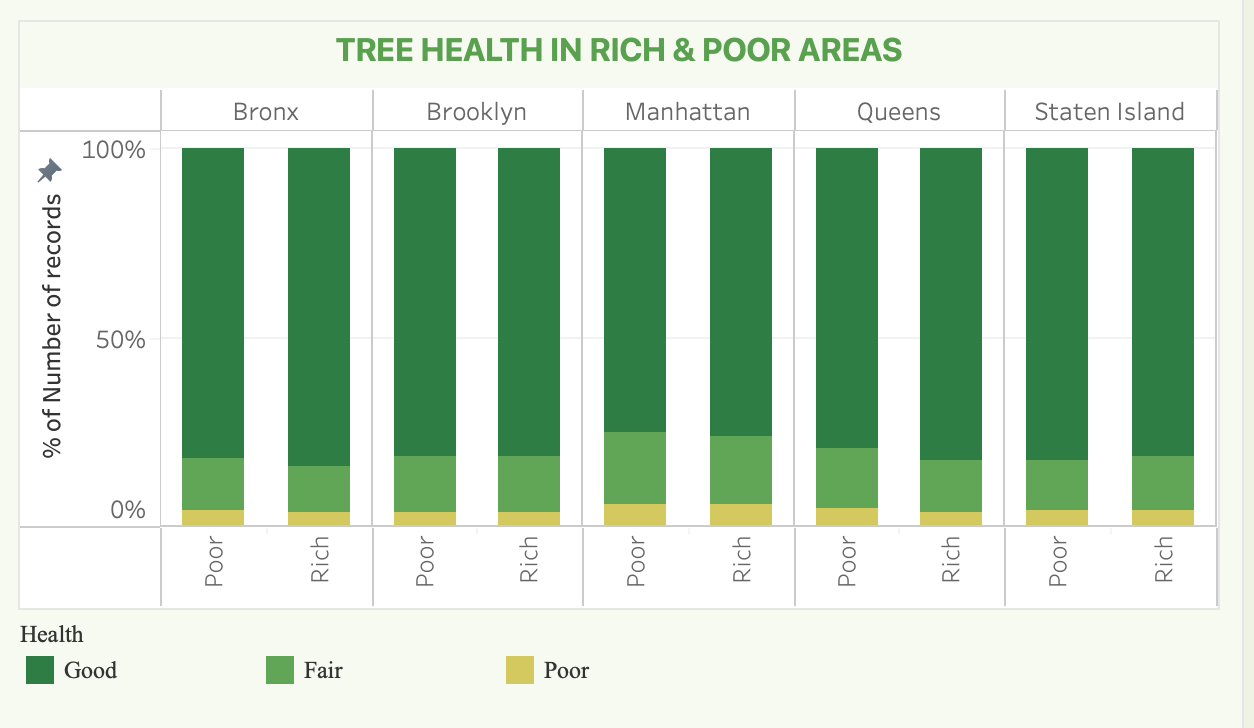
Splitting each borough into Rich vs Poor areas, Good health still dominates (~80–85%) on both sides. Manhattan shows a bit more Fair/Poor than the outer boroughs, and some lower-income pockets in Queens and Brooklyn tick Fair/Poor slightly higher — a maintenance signal, not a collapse of canopy quality by wealth.
Finding 4 — Size and age skew small, with rare giants
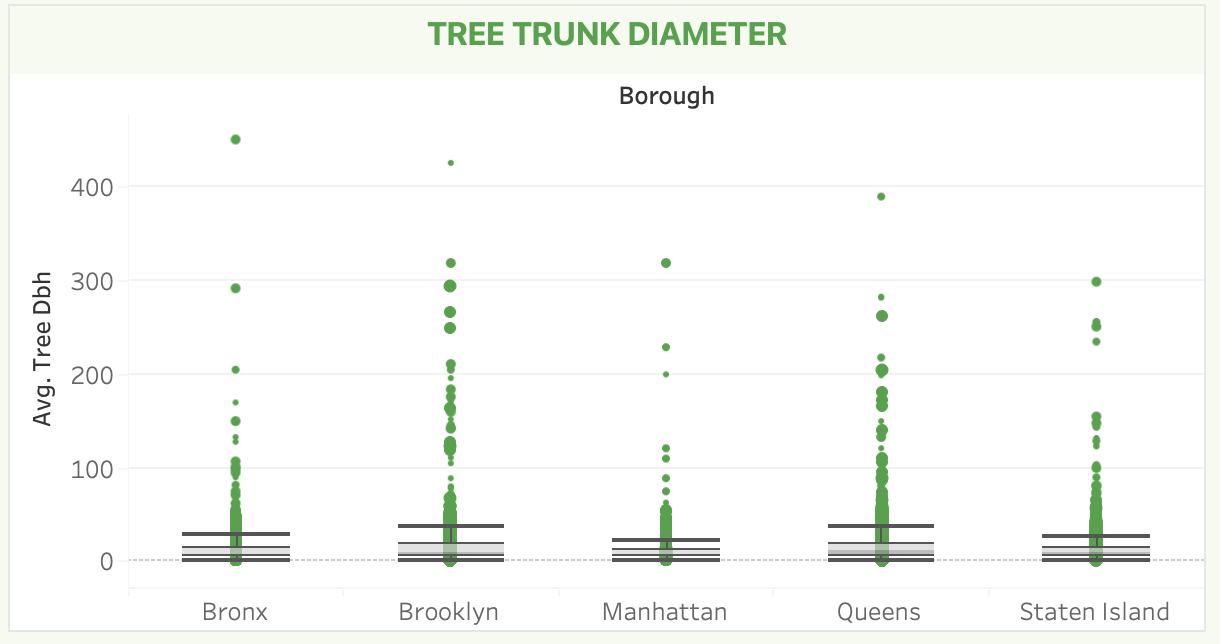
DBH (diameter at breast height) clusters under ~50 inches citywide, with outliers stretching past 300–400 inches in every borough. Brooklyn and Queens host more of those large specimens; Manhattan’s distribution sits lower on average — consistent with denser streetscapes and younger replacements.
Finding 5 — Wealthier is not greener
Median income by neighborhood spans roughly $31.5k to $243k. Manhattan concentrates the darkest (highest-income) tracts; parts of the Bronx and Brooklyn sit at the light end. Pair that map with canopy volume and the equity claim breaks: high-income Manhattan is tree-scarce; mid-income Queens carries the largest share of street trees.
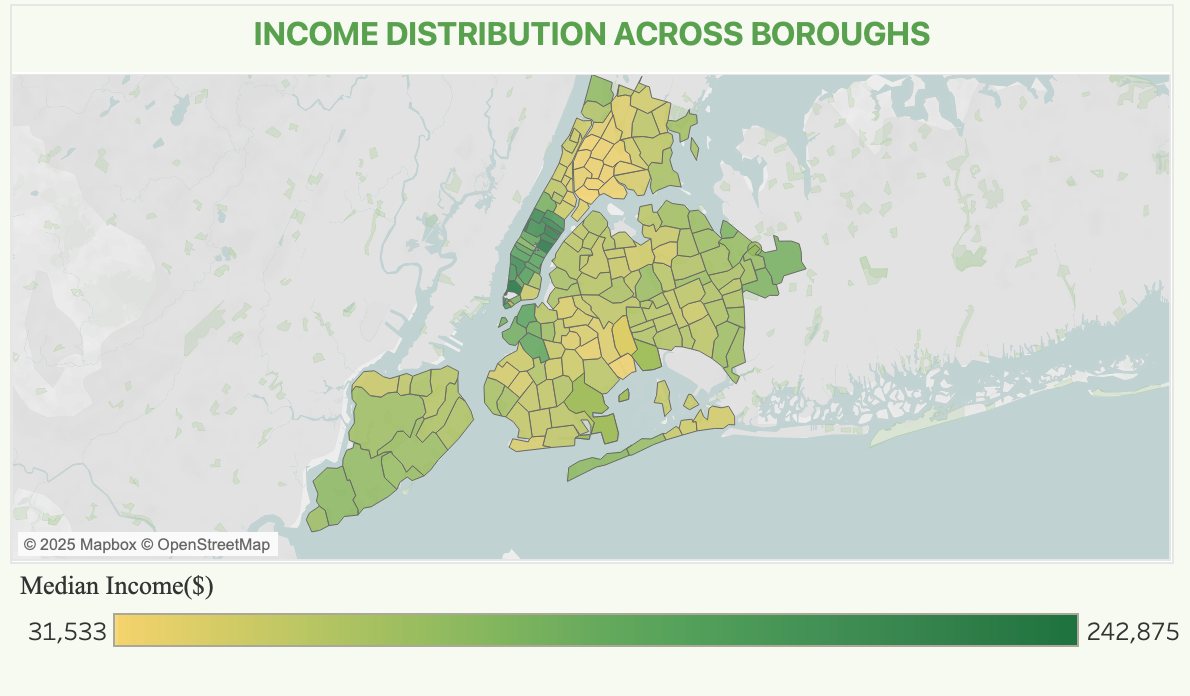
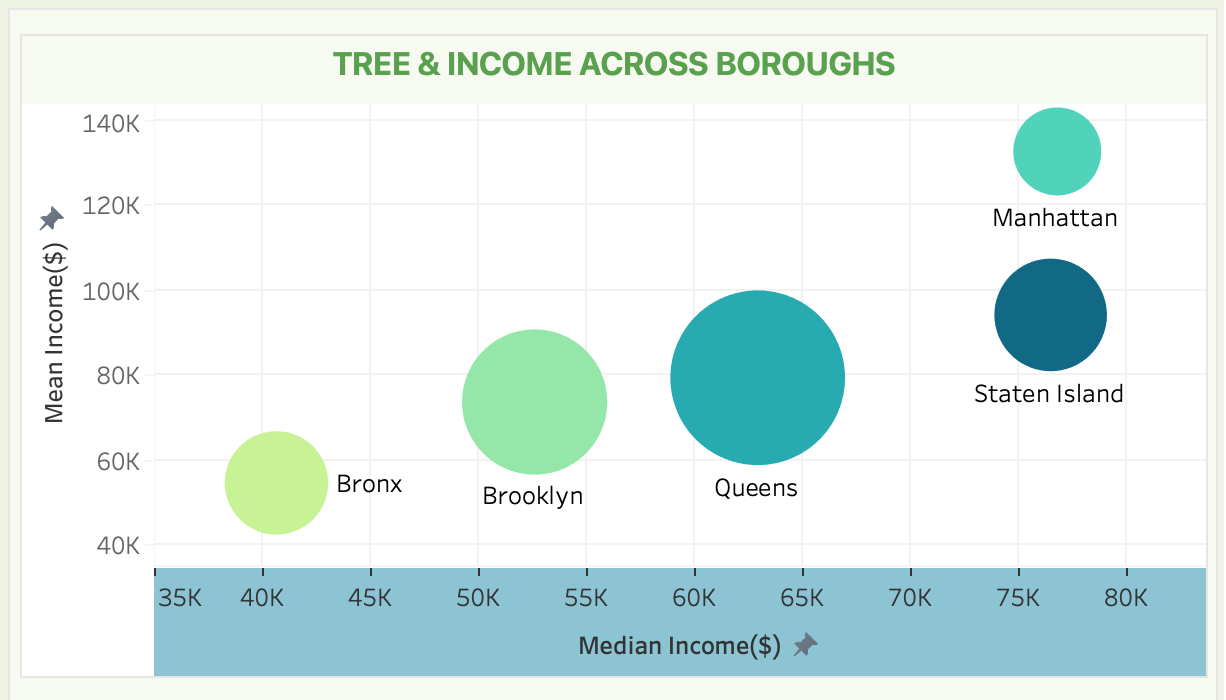
Higher income does not mean more trees. Urban density and historical land use explain canopy better than zip-code wealth — so equitable planting should target canopy gaps, not assume affluent neighborhoods are already green.
Recommendations to NYRP
- Boost planting in tree-scarce Manhattan with creative urban greening, while treating Queens’ canopy as a reference model
- Targeted maintenance and community education in lower-income Queens and Brooklyn pockets with higher Fair/Poor shares
- Pair new projects in low-income Bronx and Brooklyn neighborhoods with sustained cover where canopy is already strong
Impact
The deliverable was a stakeholder-ready dashboard and briefing that turns open census and income data into priority maps for environmental equity — so NYRP can allocate planting and maintenance where residents lack healthy canopy, not where income alone suggests it.
Interested in similar work? Get in touch.