NYC Congestion Pricing and Rideshare Driver PaySQL · Python · Tableau
Analyzed 3.55M Uber and Lyft trips with SQL and a difference-in-differences design, plus a placebo test, to measure what NYC congestion pricing changed for riders and drivers.
Role
Data Analyst
Category
Business Intelligence
Year
2026
Deliverables
MySQL star schema, SQL analysis, regression and placebo tests, Tableau dashboard
3.55M
Uber and Lyft trips analyzed
+0.79 mph
Uber zone speed gain vs other trips
$1.50
Fee per Uber or Lyft zone trip
2023–25
Feb–Apr, with a no-fee placebo year
The question
On January 5, 2025, New York began tolling vehicles that enter Manhattan at and below 60th Street. Uber and Lyft trips pay a $1.50 fee per trip into or within the zone, collected from the rider. If rides cost more, fewer people might ride and drivers could earn less. If traffic moves faster, drivers could finish more trips per hour. What actually changed for riders and drivers?
Approach
- Took a seeded 2% sample of NYC TLC High Volume For-Hire trip records (Uber and Lyft, February to April of 2023, 2024 and 2025), about 3.55M trips, and checked the sample's averages against the full file
- Built a MySQL star schema (one trip fact table, company and zone dimensions) and flagged impossible trips instead of deleting them (0.02% of trips)
- Derived the congestion zone from the data: a taxi zone counts as inside when at least 90% of its internal trips paid the fee, giving 37 Manhattan zones
- Used a difference in differences design: how much zone trips changed compared with all other trips over the same months, so citywide shifts cancel out. Each gap was tested with a regression, with standard errors clustered by pickup zone
- Ran a placebo test on 2023 vs 2024, a year with no fee, to check the comparison groups were moving in step
What the data showed
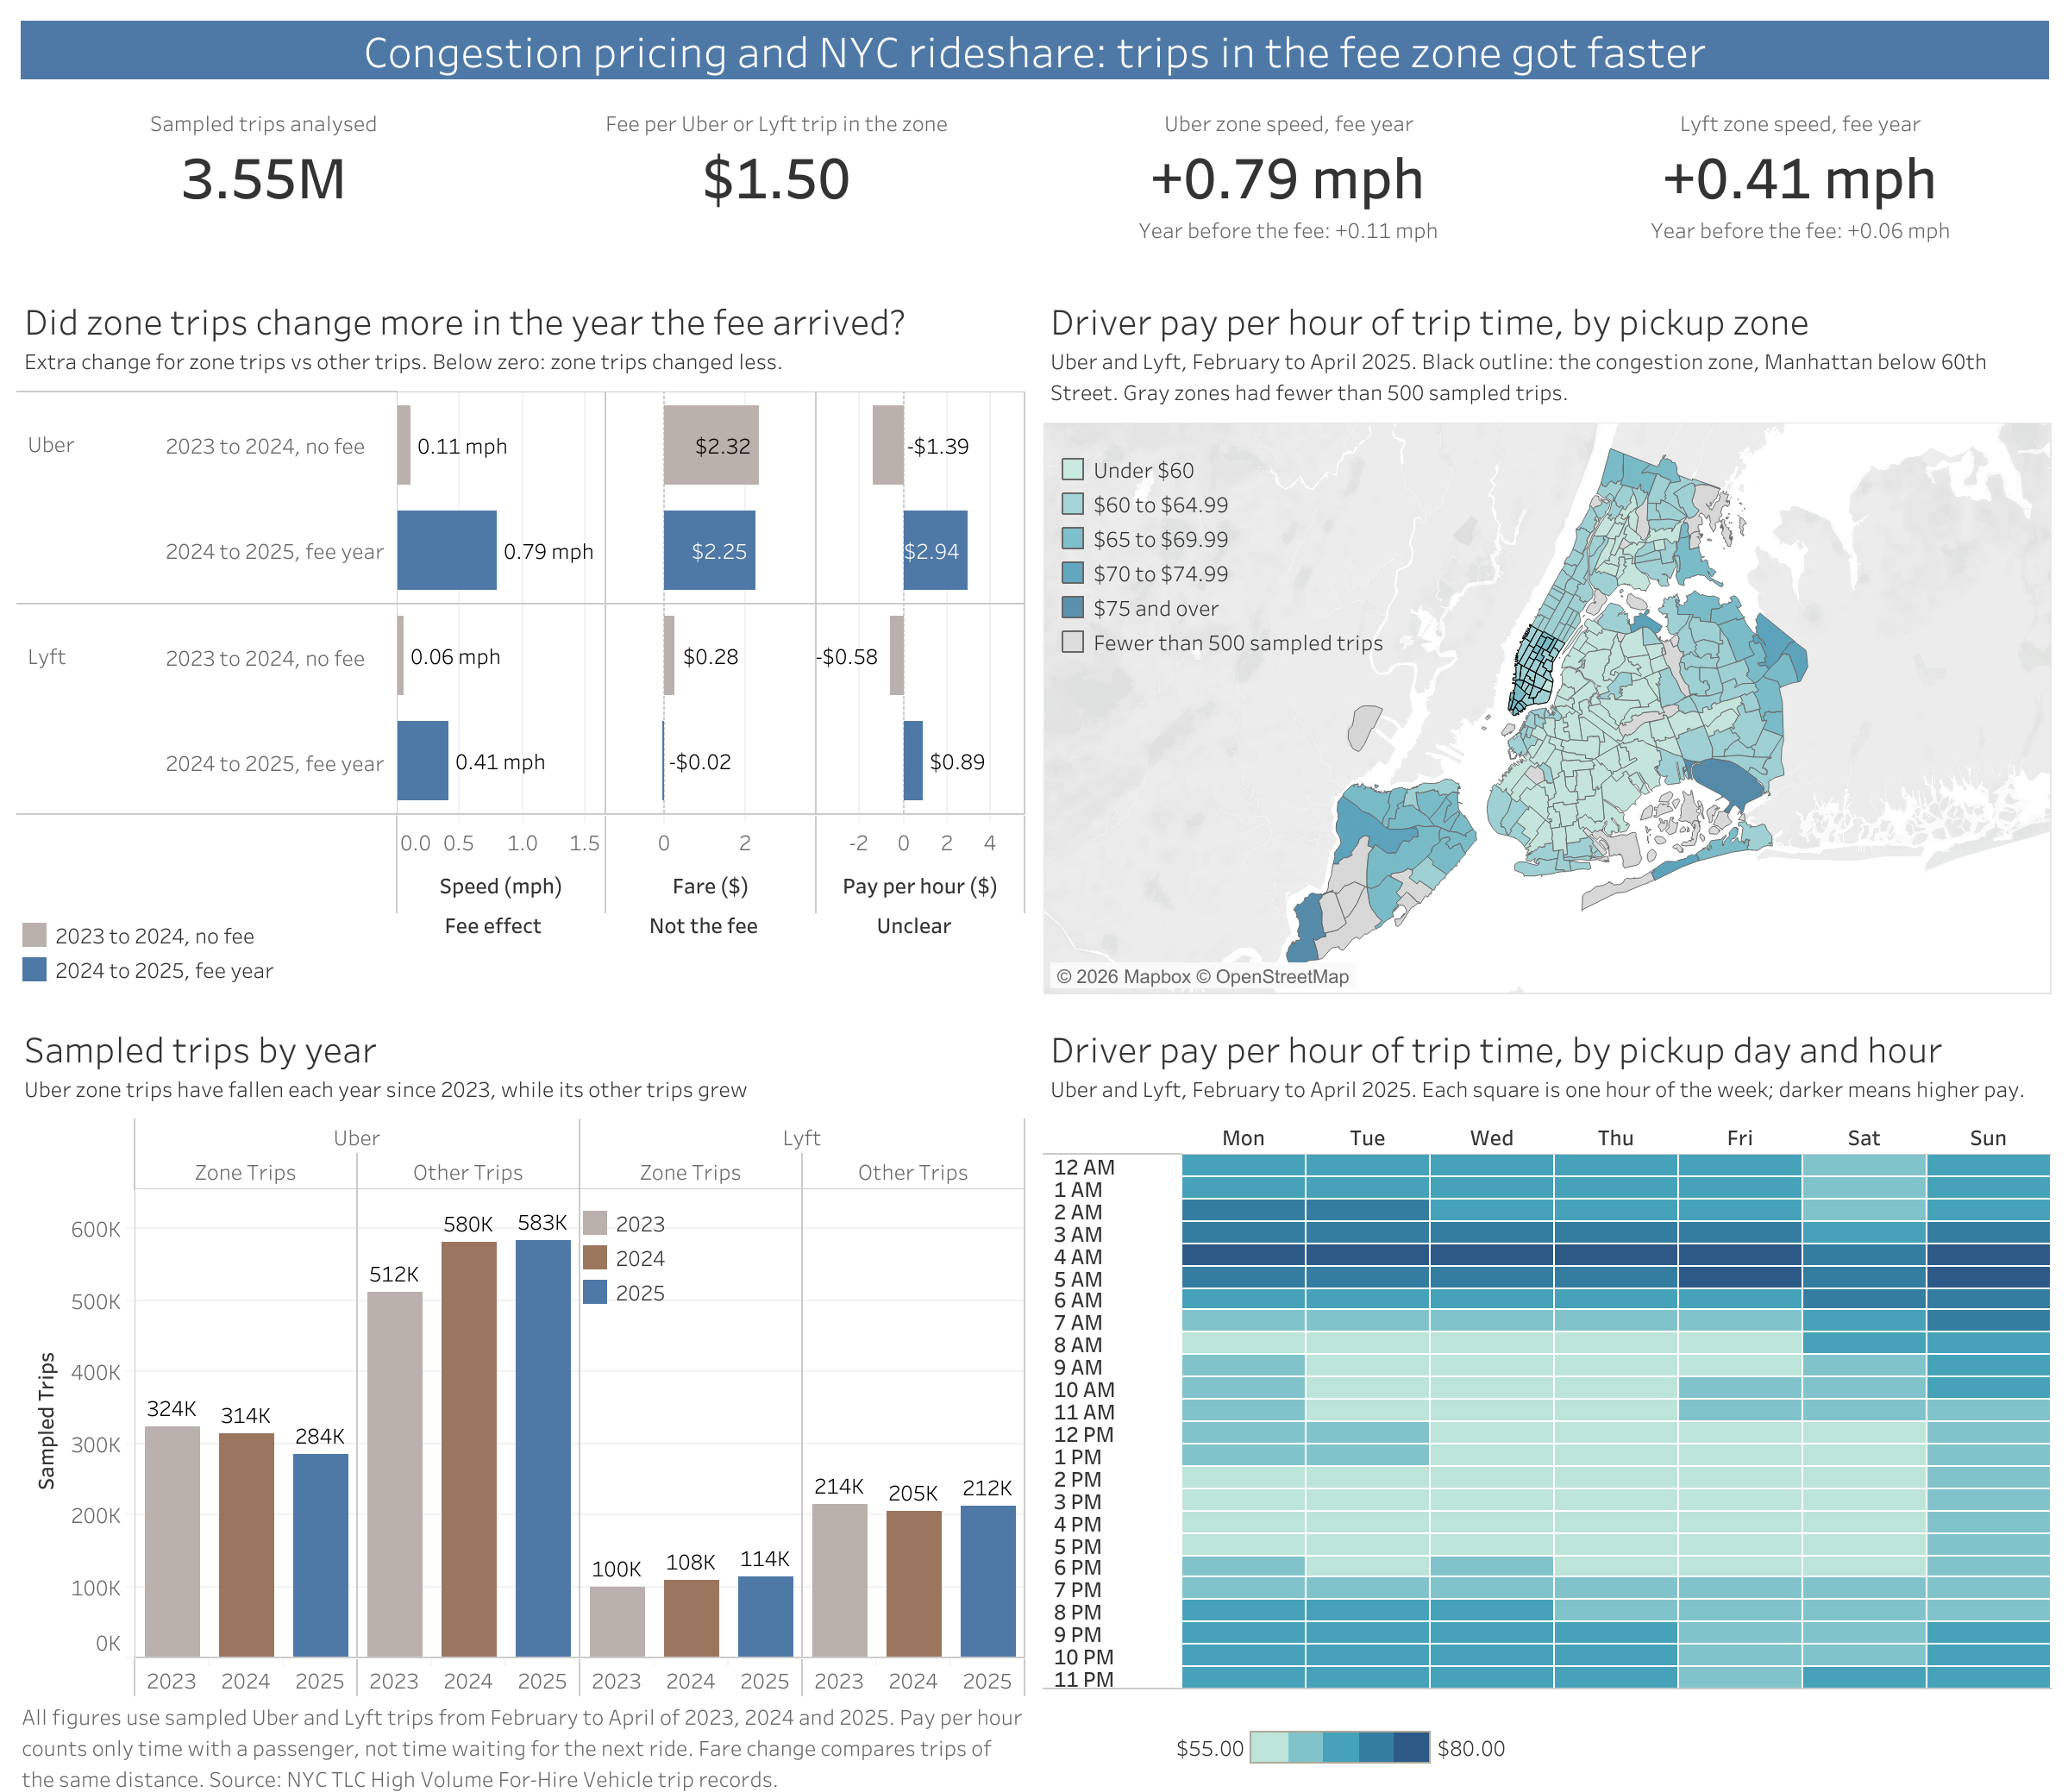
- Traffic in the zone got faster. Zone trips gained 0.79 mph more than other trips for Uber and 0.41 mph for Lyft, against almost no gap the year before
- Uber fares rose more than the fee, but not because of it. Zone fares rose $2.25 more at the same distance, yet had risen $2.32 more the year before the fee existed. Lyft riders paid about the fee alone
- Driver pay per hour turned from falling to rising in the zone (+$2.94 Uber, +$0.89 Lyft), which fits faster trips, though the exact size can't be pinned to the policy
- Drivers earn the most per hour at the airports (JFK $77.58, LaGuardia $74.36) and from 3 to 6 AM; weekday afternoons from 2 to 5 PM pay least
Key finding
The placebo test changed the story. Faster traffic is the one effect clearly tied to congestion pricing; the higher Uber fares and the larger share Uber kept were already trending before the fee.
Limitations
- Only one pre-fee year in the placebo comparison, and other 2025 changes inside the zone could also play a part
- Pay per hour counts only time with a passenger, and excludes tips and tolls, so real hourly earnings are lower
- Zone edges follow taxi zones, which don't match the 60th Street boundary exactly
Why this matters
A simple before-and-after comparison would have credited congestion pricing with Uber's fare rise. Checking the comparison against a year with no fee is what separated the effect the policy caused from the trend it inherited.
Interested in similar work? Get in touch.